Real-time Web Analytics just took a step forward with Pion v4

Awesome news from Atomic Lab’s that Pion 4.0 has been released!

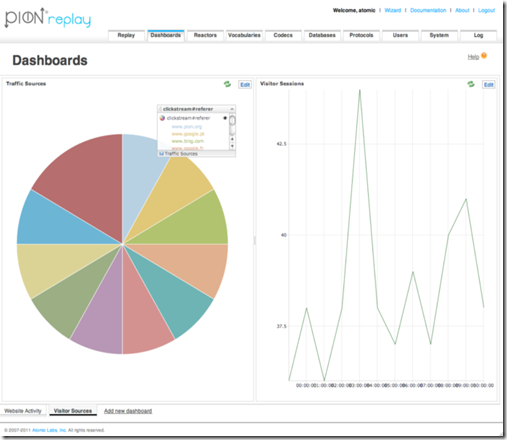
The new Dashboard functionality looks amazing – real-time web analytics likes page views, visitor sessions etc as well as performance analytics like load time and server reply time – along with the usual Pion goodness like tag-free analytics and customer journey visualisation with the Replay feature.

image

image

Can’t wait to implement this on some customer sites!

Comments

Popular posts from this blog

So what else does Operations do? Well, there is a whole organisation run by the UK govermnent to help answer that question! ITIL , or the IT Infrastructure Library, is a library of best practice information that basically tells you everything you need to do to run an IT department. Similarly developers have development methodologies such as RAD, JAD, Agile/XP, and Project Managers have PM methodologies such as Prince 2, PMBok etc to cover off their areas in more specific detail. ITIL breaks it down into 7 key areas: Service Support - deals with the actual provision of IT services such as the service (help) desk, incident management, problem management, release management etc Service Delivery - deals with ensuring that you can continue to DELIVER the service support functions with things like contigency planning, capacity management, service levels etc The Business Perspective - helps to ensure that the IT function is aligned with the organisation's business strategy and that how to

Real-time Performance Analytics with Pion and WebTuna

One of my goals is to create an easy to implement real-time web performance analytics solution that doesn’t rely on fragile, inaccurate javascript tags and I have been playing around with an idea on the weekend. I used the performance measurement and analytics stream generation capabilities of Atomic Lab’s Pion to inspect the HTTP traffic directly off the network and measure the page load performance. I then used some simple Python scripting within Pion to generate a beacon to www.webtuna.com , a UK-based performance analytics provider. I then fired up webpagetest.org and generated some traffic from different nodes around the world and you can see the results graphically in the screen shot below. The end result is a proof of concept that works brilliantly to tell you who is on your website, where they come from, what pages they have visited… and how fast the page appeared to load from the end-user’s perspective. Keep in mind these are page load times, not server response

Web Performance 101

I gave my Web Performance 101 presentation at the London Web Performance Meetup on Tuesday and it appeared to go down well! I have uploaded the presentation to Slideshare for future reference and it’s had > 500 views in 24 hours, so it goes to show that web performance is a hot topic! Web performance 101 View more presentations from Stephen Thair .