The Grand National is one of the largest events in the UK horse racing calendar, and that means hundreds of million of pounds at stake for the online bookmakers and gambling sites.
It also means a major headache for the web operations teams as they deal with the inevitable traffic spikes hammering their sites, at a time when availability and performance direct equate to money won or lost.
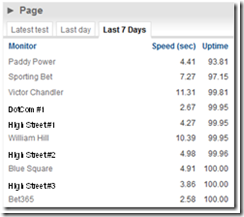
Site Confidence monitored the home pages of ten of the top ranking online gambling sites on the Grand National Saturday, and some fascinating patterns emerged in the lead up to the race (16:15 BST).
Firstly, lets look at the Contenders…
You can immediately see a range of availability and performance, with some of the traditional “bricks and mortar” bookmakers considerably slower than the pureplay dotcom’s like “DotCom #1” and Bet365.
Option 1 – Do nothing… and #fail
The first option is to “do nothing and hope for the best” approach, as seen in the graph above for William Hill, a traditional “High Street” betting shop.
No changes to the page size (light grey) and highly erratic page download speed giving a poor user experience to their customers… and presumably significant revenue leakage.
Option 2 – Peak Capacity
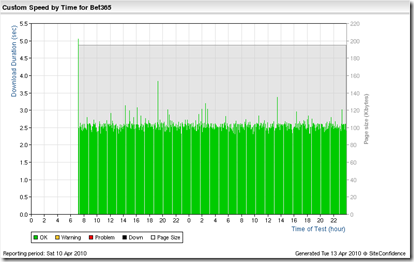
Bet365 appear to have weathered the storm without a blip – rock solid response time across the critical period (albeit with a “light” home page anyway).
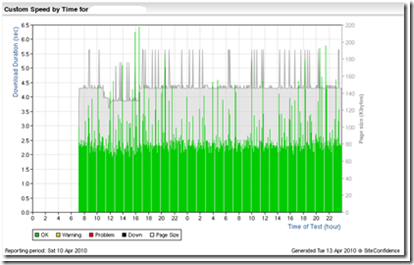
“DotCom #1” also managed to keep performance fast (average around 2.5s with some ~5 sec spikes) whilst still serving up a “full sized page”.
Presumably both of these “pure play” dotcom sites have a capacity planning model that has sized their infrastructure and application performance at a sufficiently high level to be able to handle the “peaks”, albeit potentially at the price of carrying excess capacity during “average” periods.
Option 3 - Lighten up to speed up
A number of sites took a middle line – reduce the page weight and serve a “stripped down” version of the site that could be served within a lower overall capacity. “High Street #3” (above) stripped their site from ~300Kb down to a super lean 70Kb page.
Blue Square took the same approach, cutting from ~500Kb to ~300Kb… but still suffering some performance hiccups.
Why good deployment processes count…
One other thing to note… whilst Option 3 is a good balance between “losing money when your site fails” and “losing money by carrying capacity you don’t need it does highlight the need for good deployment processes… because otherwise you can end up with an inconsistent site (page size) across your web farm.
In the two graphs below you see a pattern of differing page sizes (presumably as the monitoring agents hit different servers in the server farm)… normally a sure sign of a site that has not been deployed consistently across the web farm!
Interesting the first (“High Street #1”) suffered the problem when they rolled out the “light” version, and the second (“High Street #2”) when they tried to roll back to the “normal” version.
Good reasons to review both the deployment plan AND the rollback plan…


Comments